NTU to PPM Calculator
Estimate TSS PPM from Turbidity (NTU) based on water source type.
Estimated TSS (Total Suspended Solids)
Methodology & Sources
Digital Nephelometer measuring water sample turbidity
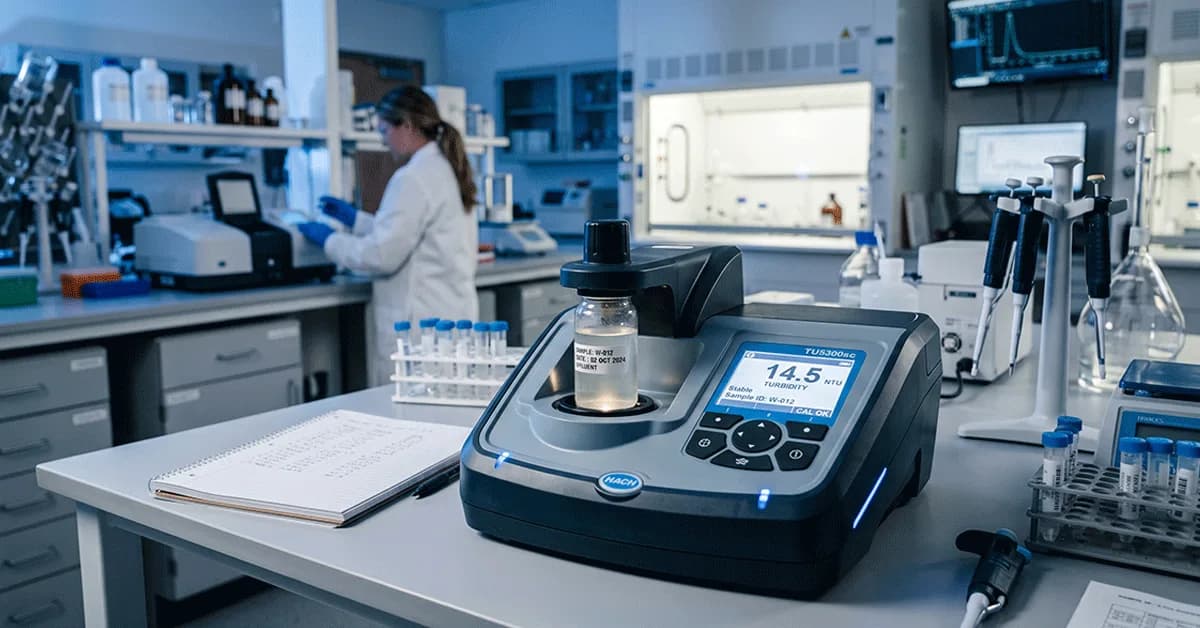
Estimating Total Suspended Solids (TSS) from a field turbidity reading is one of the most frequent conversions performed by environmental engineers, water treatment plant operators, and field researchers. While there is no universal direct conversion between Nephelometric Turbidity Units (NTU) and Parts Per Million (PPM), you can achieve highly accurate estimations by applying a site-specific correlation factor. This guide explains the physics behind the conversion, how to calculate your own correlation factor, and why optical clarity differs from physical mass.
1. Understanding Turbidity vs. Mass Concentration
Before applying mathematical formulas, it helps to understand exactly what these two units represent. Nephelometric Turbidity Units (NTU) measure the optical clarity of water. When you insert a vial of water into a digital nephelometer, the device shoots a beam of light through the sample. A sensor positioned at a 90-degree angle measures how much of that light scatters sideways. If the water is full of suspended dirt, silt, clay, or biological matter, more light scatters, resulting in a higher NTU reading.
Parts Per Million (understanding Parts Per Million), on the other hand, measures physical mass concentration. In water testing applications, one Part Per Million is functionally identical to one milligram per liter (milligrams per liter mass conversion). When a laboratory tests water for Total Suspended Solids (TSS), they physically filter a known volume of water, dry the filter in an oven, and weigh the remaining solids on a highly sensitive analytical balance.
The challenge with converting NTU to PPM is that light scattering does not perfectly align with physical weight. A handful of heavy, dark sand might weigh a lot (high PPM) but sink quickly and scatter very little light (low NTU). Conversely, a tiny amount of microscopic white clay particles might weigh almost nothing (low PPM) but remain suspended and scatter a tremendous amount of light (high NTU). Because of this variability, a rigid 1-to-1 conversion is scientifically impossible. You must establish a relationship specific to the water you are testing.
2. The Core Conversion Formula
To accurately convert NTU to an estimated PPM (TSS mg/L), environmental engineers multiply the field turbidity reading by a water-specific correlation factor. This mathematical relationship assumes that the nature of the suspended particles at a specific site remains relatively constant over time.
The Estimation Equation
For this equation to hold true, the water sample must be fully agitated and tested immediately. Suspended solids begin settling the moment water stops moving. If you wait five minutes to test a sample drawn from a river, the heaviest particles will have settled below the light beam's path inside the testing vial, artificially lowering your NTU reading and ruining the accuracy of your PPM conversion.
3. Applying Standard Industry Correlation Factors
If you do not have access to a certified laboratory to determine your exact site-specific multiplier, you can rely on standard industry estimates. Decades of environmental water quality testing have established generalized correlation factors for different types of water bodies.
-
1
Treated or Clarified Water (Factor: 1.0 to 1.5)
Municipal drinking water and clarifier effluent generally contain very fine, consistent particles. Because heavy particulates have already been settled or filtered out, the remaining particles scatter light very efficiently relative to their mass. In these clean environments, the correlation factor usually hovers close to 1.0.
-
2
Raw Surface Water (Factor: 1.5 to 2.0)
Natural rivers, lakes, and streams contain a complex mixture of sand, silt, clay, algae, and organic detritus. This mixture is heavier and scatters light less efficiently than clarified water. For general environmental monitoring without lab data, engineers universally default to a correlation factor of 1.5.
-
3
Wastewater and Heavy Sludge (Factor: 2.0 to 3.0+)
Raw sewage, agricultural runoff, and industrial wastewater contain dense, heavy biological matter. Because these particles are massive but do not scatter light proportionally, you must multiply the NTU reading by a much larger factor to estimate the true physical mass in PPM.
How to Calculate a Custom Site-Specific Factor
Relying on generic industry factors introduces a margin of error. If you are conducting academic research, managing a commercial wastewater permit, or dealing with strict environmental compliance, you need to calculate your own exact multiplier. The process requires a field nephelometer and access to a certified analytical laboratory.
First, collect a representative water sample from your specific site. Immediately test the sample in the field using your calibrated turbidity meter and record the exact NTU reading. Next, pack the remaining sample in ice and send it to a laboratory requesting a standard Total Suspended Solids (TSS) dry-weight analysis (EPA Method 160.2 or Standard Method 2540 D). Once the laboratory returns the certified physical mass result in mg/L (PPM), you simply divide the lab result by your original field reading.
Example Calculation Scenario
You test water at a stormwater discharge pipe and your digital meter reads exactly 14.5 NTU. Two days later, the laboratory analysis returns a TSS result of 26.1 mg/L for that exact same water sample.
Factor = 26.1 PPM / 14.5 NTU = 1.8
You have now scientifically proven that the correlation factor for this specific discharge pipe is 1.8. Moving forward, you can take instant field NTU readings and multiply them by 1.8 to get highly accurate, lab-equivalent PPM estimates without having to wait for actual laboratory analysis. (Note: If you already know the PPM and need to estimate the optical clarity, you can use our reverse PPM to NTU optical clarity calculator).
4. Quick Reference: NTU to PPM Estimation Table
To give you a practical sense of how these numbers scale in the real world, the table below provides standard conversion estimates based on a generic raw surface water correlation factor of 1.5. This represents typical conditions you might encounter in rivers, streams, and lakes.
| Field Turbidity (NTU) | Estimated Mass (PPM) | Visual Water Profile |
|---|---|---|
| 1.0 NTU | 1.5 mg/L | Crystal clear municipal drinking water |
| 5.0 NTU | 7.5 mg/L | Slightly hazy; visible cloudiness begins |
| 10.0 NTU | 15.0 mg/L | Standard healthy raw river water |
| 25.0 NTU | 37.5 mg/L | Murky water after a light rainstorm |
| 50.0 NTU | 75.0 mg/L | Heavy agricultural runoff; completely opaque |
5. Limitations of Turbidity Conversions
It is critical to remember that converting NTU to PPM has inherent chemical limitations. Turbidity only accounts for suspended solids. It completely ignores dissolved solids. If you pour a cup of salt into a glass of pure water, the salt will dissolve entirely. The NTU reading will remain at 0.0 because there are no floating particles to scatter light, but the actual mass concentration of the water has increased by thousands of PPM.
Because of this blind spot, a nephelometer should never be used as a substitute for an electrical conductivity meter when attempting to measure Total Dissolved Solids (TDS). Turbidity meters are strictly optical instruments designed exclusively to measure physical particulate matter, organic detritus, and suspended minerals that block the transmission of light.
References
- USGS Water Quality Monitoring
- EPA Method 180.1
- ISO 7027
Frequently Asked Questions
How do you convert turbidity NTU to TSS mg/L?
What is 1 NTU equal to in PPM?
Is NTU the same as mg/L?
Can you measure TDS with a turbidity meter?
How do I find my water correlation factor?
What is the difference between NTU and FNU?
What is a good turbidity level for drinking water?

Lead Developer & Technical Editor
Ensuring every tool adheres to ASTM/IUPAC standards. Committed to providing precise, transparent, and verifiable engineering resources.
View Full ProfileScientific Accuracy
Formulas and logic verified against IUPAC and ASTM standards. Maintained and tested by technical editors.
View Editorial PolicyBookmark this tool for instant access. 100% free, verified accuracy, and ad-free experience.